What is the Formula for Lifetime Value of a Customer?

Most Shopify store owners calculate customer lifetime value using a single revenue formula, then wonder why their retention strategies aren't paying off. Here's the uncomfortable truth: you're probably measuring the wrong number. A customer generating $5,000 in revenue might actually be destroying profit if they're costing you $4,800 to serve. Yet almost 60% of businesses struggle to calculate CLV accurately, relying on simplistic formulas that ignore costs, churn dynamics, and the actual financial reality of keeping customers around.
The formula for lifetime value isn't one-size-fits-all. Revenue-based CLV gives you a starting point, but profit-based CLV tells you the real story. For subscription businesses, churn rate becomes the lever that makes everything else irrelevant. For ecommerce, gross margin percentage transforms a vanity metric into actionable business intelligence.
This guide walks you through the formulas that actually matter, explains why most merchants get this wrong, and shows you exactly how to calculate CLV in ways that drive real strategic decisions.
What is the Formula for Lifetime Value of a Customer?
Customer Lifetime Value is the total profit (not just revenue) a business expects from a single customer over the entire relationship. Think of it like this: if you acquire someone for $50 and they spend $500 over three years while costing you $300 to service, their actual CLV is $200, not $500. That distinction changes everything about how you should think about acquisition, retention, and growth.
The basic revenue-based formula looks simple:
CLV = Average Order Value (AOV) × Purchase Frequency × Customer Lifespan
But simplicity is the problem. This formula ignores the costs embedded in every transaction. A more accurate approach includes gross margin:
CLV = (Average Order Value × Purchase Frequency × Customer Lifespan) × Gross Margin %
For subscription businesses where revenue repeats, the formula shifts entirely:
CLV = (Average Revenue Per User / Churn Rate) × Gross Margin %
Notice the shift from time-based lifespan to churn rate. That's because with recurring revenue, stability matters more than arbitrary time periods. One of the least understood facts in ecommerce: the average Shopify store sees 70-75% annual churn, meaning your baseline retention sits around 25-30%. A formula that ignores this reality is ignoring your biggest vulnerability.
Understanding Customer Lifetime Value: More Than Just a Number
CLV represents a strategic shift away from transaction-based thinking. Instead of asking "Did this customer pay for the marketing cost to acquire them?", you ask "What's the total profit I'll generate from this relationship?"
This forward-looking perspective changes how you allocate resources. A customer acquired for $100 might seem expensive until you realize they'll spend $600 over 18 months while contributing $240 in gross profit after direct costs. Suddenly, that acquisition investment makes sense.
The reason profit matters so much is subtle but critical. Two customers with identical $1,000 purchase histories can have dramatically different CLVs depending on what they cost to serve. A high-touch customer requiring extensive support, frequent returns, and custom fulfillment might generate only 20% gross margin. A low-maintenance customer buying standardized products might hit 45% margin. Same revenue, completely different value. When you ignore this distinction, you're optimizing for the wrong customers.
Ready to increase customer lifetime value?
Join 100+ Shopify stores using Mage to turn one-time buyers into loyal repeat customers.
Why Customer Lifetime Value is Your Business's North Star
CLV guides nearly every meaningful business decision you'll make.
Marketing and Acquisition Decisions: Knowing your CLV tells you exactly how much you can afford to spend acquiring new customers. If your CLV is $300 and your CLV:CAC ratio should be 3:1 for healthy growth, you can't spend more than $100 acquiring someone. Most brands don't know this threshold, which is why they overspend on ads chasing unprofitable customers. The research is clear: customer acquisition costs 5-25 times more than retention, yet most marketing budgets flip this ratio backwards.
Customer Retention and Loyalty Strategy: A 5% increase in customer retention can boost profits by 25-95%. That's not a typo. This relationship is exponential because retention extends the lifespan variable in your CLV formula directly. Every month a customer stays active multiplies your profit. This is why fostering loyalty and retention through structured programs delivers such outsized returns. Existing customers spend roughly 67% more than new ones, but that advantage only compounds over time.
Business Health Indicator: CLV reflects overall customer satisfaction, product-market fit, and operational efficiency. When CLV trends upward, you're building something sustainable. When it declines, you're either acquiring the wrong customers, losing good ones too quickly, or your costs are rising faster than your pricing. About 65% of company revenue comes from existing customers, so if that portion is shrinking, your growth is becoming fragile.
Resource Allocation: Understanding which customer segments have higher CLV lets you invest strategically. Maybe your email channel generates customers with 40% higher CLV than your paid social channel. That's a signal to shift budget. Perhaps customers acquired through organic social stick around 8 months longer than those from paid ads. That changes your channel prioritization entirely.
Decoding the Formulas: The Mechanics of CLV Calculation
There's no single universal CLV formula because different business models generate revenue differently. But they all rest on the same foundation: understanding how customers behave over time and what profit they generate.
The Basic Revenue-Based CLV Formula
CLV = Average Order Value (AOV) × Purchase Frequency × Customer Lifespan
This formula works when you understand each component.
Average Order Value is total revenue divided by total number of orders. If you did $100,000 in revenue across 1,000 orders, your AOV is $100.
Purchase Frequency is how often a customer buys within a specific period, typically one year. If your average customer places 4 orders per year, that's your multiplier.
Customer Lifespan is the average duration a customer remains active. If most customers shop with you for roughly 3 years before churning, that's your timeframe.
Multiply these together: $100 × 4 × 3 = $1,200 CLV.
This formula works fine for initial estimates or rough comparisons between customer segments. But here's its fatal flaw: it treats all $1,200 equally, regardless of whether you made 20% or 50% profit on those sales. A customer costing you 60% of revenue to acquire and serve is worthless at $1,200 revenue, even though the formula makes them look valuable.
The Profit-Based CLV Formula (The More Accurate Version)
CLV = (Average Order Value × Purchase Frequency × Customer Lifespan) × Gross Margin %
This is where the calculation starts reflecting reality. Gross margin percentage is (Revenue – Cost of Goods Sold) / Revenue.
Using the same example: $1,200 × 0.35 (35% gross margin) = $420 actual CLV.
That $780 difference isn't semantic. It's the gap between feeling successful and actually being profitable. Many Shopify stores operate on 30-40% gross margins after accounting for product costs, shipping, and fulfillment. That margin percentage should anchor every decision.
Why is this superior? Because it connects your CLV calculation to actual dollars flowing through your business. When you present CLV to your finance team or use it to justify marketing spend, they understand immediately. Revenue-based CLV creates arguments about what's "real" value. Profit-based CLV ends those arguments.
CLV Formula for Subscription and SaaS Businesses
CLV = (Average Revenue Per User / Churn Rate) × Gross Margin %
This formula acknowledges a fundamental difference in recurring revenue models. You don't need to estimate a customer lifespan because you can calculate it directly from churn rate.
If your monthly churn rate is 5%, you can expect each customer to stay 20 months (1 / 0.05 = 20). If it's 10%, that drops to 10 months. The formula inverts the relationship: lower churn automatically extends CLV.
Average Revenue Per User (ARPU) for subscriptions is monthly recurring revenue divided by total active accounts. If you generate $50,000 monthly from 500 subscribers, your ARPU is $100.
So: ($100 / 0.05) × 0.40 = $800 CLV for a 5% monthly churn rate at 40% gross margin.
Change that churn rate to 8%? Now it's ($100 / 0.08) × 0.40 = $500 CLV. Same product, same revenue, dramatically different value. This is why subscription businesses obsess over churn reduction. It's not a nice-to-have improvement; it's the primary lever moving CLV.
The Time Value of Money: Why Advanced CLV Discounts Future Profits
Here's where most articles stop, and where actual financial sophistication begins. Money earned today is worth more than the same amount earned a year from now because of inflation and investment opportunity. A dollar received in year one has more purchasing power than a dollar received in year three.
When calculating true economic value, you should discount future cash flows back to their present value. This typically uses a discount rate of 8-15% annually, depending on your cost of capital and risk profile.
Why does this matter? It prevents you from overestimating CLV for customers with long lifespans. A customer generating $100 profit annually for five years doesn't have $500 CLV. When discounted at 10% annually, that's closer to $380 present value. The difference grows with longer timeframes and becomes crucial for strategic planning.
For most Shopify stores, this discounting doesn't dramatically change decisions because average customer lifespans are relatively short (often 1-2 years). But if you're building brand equity and thinking about premium customers who might stay 5+ years, ignoring the time value of money inflates your CLV estimates by 20-30%.
Essential Metrics That Fuel Your CLV Calculations
Every CLV formula rests on four or five core metrics. Understanding how to calculate and interpret them matters more than memorizing formulas.
Average Order Value (AOV): Total revenue divided by total number of orders. Track this monthly because it reveals pricing strategy effectiveness and product mix shifts. If your AOV increases without intentional changes, customers are buying larger quantities or higher-priced items. If it decreases, competitive pressure or seasonal shifts might be affecting purchasing patterns.
Purchase Frequency: Total orders divided by total unique customers, usually measured annually. A frequency of 2 means customers buy twice yearly on average. This metric is sensitive to seasonality. A fashion brand might show 5x frequency during Q4 and 1x frequency in Q2. Smooth this over full years to avoid seasonal distortion.
Customer Lifespan or Retention Period: The average time between first and last purchase. This is inversely related to churn rate. If 10% of customers churn monthly, average lifespan is 10 months. If 20% churn, it drops to 5 months. Track this as a trend line because it reveals whether your retention efforts are working.
Churn Rate: The percentage of customers who become inactive over a period. For Shopify stores, baseline annual churn sits between 70-75%, implying retention around 25-30%. Monthly churn is more actionable for trend monitoring. A 5% monthly churn (60% annually) is strong for most direct-to-consumer brands. A 10% monthly churn signals serious retention problems.
Average Revenue Per User (ARPU) or Account (ARPA): Monthly recurring revenue divided by active accounts. For subscriptions, this stabilizes across months. For seasonal businesses, this fluctuates significantly. Use trailing twelve-month (TTM) ARPU to smooth seasonal variations.
Gross Margin %: Revenue minus cost of goods sold, divided by revenue. This percentage captures all direct product costs but excludes operating expenses. A 40% gross margin means 40 cents of every dollar covers overhead, marketing, and profit. Margins vary wildly by vertical. Luxury goods might hit 60%+. Commodities often sit at 20-30%.
CLV in Action: Practical Calculation Examples
Let's work through two realistic scenarios to show how these formulas operate in practice.
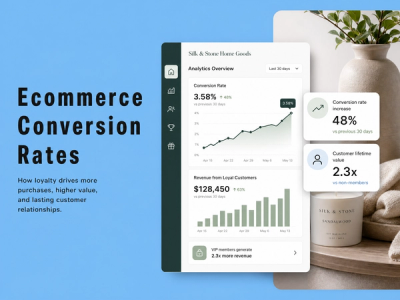
E-Commerce Example: Premium Home Decor Brand
Imagine a Shopify store selling home decor with the following metrics:
- Average Order Value: $125
- Annual Purchase Frequency: 2.5 orders
- Average Customer Lifespan: 3 years
- Gross Margin: 42%
CLV = ($125 × 2.5 × 3) × 0.42 = $393.75 per customer
This tells the founder that acquiring a customer for $100-120 makes financial sense, but spending $150 per acquisition is reckless. It also signals that retention initiatives worth up to $75-100 per customer (like a loyalty program) can still be profitable.
If they could extend customer lifespan to 4 years through better post-purchase engagement, CLV jumps to $525, creating a $131 increase in lifetime profit per customer. For a brand with 5,000 annual customers, that's $655,000 in additional profit from better retention.
Subscription Example: Monthly Coffee Subscription
Consider a subscription service with:
- Monthly ARPU: $35
- Monthly Churn Rate: 3%
- Gross Margin: 55%
CLV = ($35 / 0.03) × 0.55 = $641.67 per customer
Now imagine they implement a loyalty program that reduces churn to 2.5%. New CLV = ($35 / 0.025) × 0.55 = $770 per customer.
That one-percentage-point churn reduction creates $128 additional lifetime value per customer. For a subscription with 2,000 active customers, improving retention from 97% to 97.5% monthly generates $256,000 in additional lifetime profit.
Here's the key insight: retention doesn't feel like it moves the needle month to month. But across a customer lifetime, it's the most powerful lever available. Think of CLV like tending a garden. Acquiring customers is planting seeds. Retention is watering and nurturing. The harvest (profit) comes entirely from plants you maintain, not from constantly replanting.
Boosting Your Customer Lifetime Value: Actionable Strategies
CLV formulas describe your current situation. But these metrics are levers you can pull.
Increasing Average Order Value
Cross-selling and upselling are the fastest ways to move AOV. When a customer adds a complementary product or upgrades to a premium tier, they increase order value without acquisition costs. A fashion brand that suggests matching accessories might increase AOV by 15-20%. A software company offering add-on modules can move AOV up 40%+.
Product bundling works because it creates perceived value. Instead of selling three items separately at $30 each, bundle them at $70 and most customers perceive savings. The AOV increases while margins often improve due to reduced per-unit fulfillment costs.
Minimum spend thresholds for free shipping also drive AOV. Setting a $75 threshold when your average is $60 incentivizes customers to add more items. Data shows free shipping thresholds increase AOV by 8-12% without reducing conversion rates.
Enhancing Purchase Frequency
Targeted promotions and re-engagement campaigns address the natural lag between purchases. Email remarketing to customers who haven't bought in 90 days (your typical purchase frequency window) is far cheaper than acquisition and remarkably effective. A "We miss you" offer with 15% off typically drives 10-15% redemption from lapsed customers.
Seamless reordering processes boost frequency by removing friction. If your product is consumable or routinely repurchased, make one-click reordering available. Subscription or auto-replenishment options increase frequency from sporadic to regular.
Extending Customer Lifespan
This is where retention programs create real value. An effective customer retention strategy reduces churn systematically through multiple mechanisms.
Robust loyalty programs directly extend customer lifespan by making switching costs visible. When a customer has 500 accumulated points or Silver tier status, leaving feels costly. Beyond the behavioral mechanics, loyalty programs deliver data insight. You can identify at-risk customers by declining engagement and intervene with targeted offers.
The financial impact is staggering. Research shows 83% of loyalty programs report positive ROI, with an average 5.2x return on investment. That means a $10,000 annual loyalty program investment typically generates $52,000 in incremental profit through extended retention.
Personalization compounds these effects. Customers receiving personalized product recommendations and offers see 10-30% higher repeat purchase rates. The gap exists because personalization feels like genuine preference rather than generic selling.
Reducing Customer Churn
Proactive churn reduction requires identifying at-risk customers before they disappear. If your customer lifespan is 36 months, a customer silent for 30 days deserves attention. A customer silent for 60 days needs intervention.
Addressing pain points prevents churn before it starts. Surveys after first purchase, post-delivery follow-ups, and support quality monitoring reveal friction points. If 30% of one-time buyers cite poor customer service, that's your priority. If product quality inconsistency generates returns, that's second priority.
Effective onboarding ensures customers realize value immediately. A beauty brand should onboard customers with usage tutorials. A software brand needs setup guidance. Poor onboarding creates silent churn where customers simply don't return because they never felt successful.
Understanding Your Investment: The CLV:CAC Ratio
Your CLV is only meaningful in relation to your Customer Acquisition Cost (CAC). The ratio tells you whether growth is sustainable.
CLV:CAC Ratio = Customer Lifetime Value / Customer Acquisition Cost
If your CLV is $400 and your CAC is $100, your ratio is 4:1. For every dollar spent acquiring a customer, you generate four dollars in lifetime profit. That's healthy. Most experts consider 3:1 the minimum threshold for sustainable growth.
A 2:1 ratio signals that acquisition is consuming most of your profit. You're growing but not actually building value. A 1:1 ratio means you're essentially breaking even on every new customer. A ratio below 1:1 is a death spiral.
Ratios above 5:1 are excellent but often signal underinvestment in acquisition. If you're generating five dollars of profit for every dollar spent acquiring customers, you should probably spend more on acquisition because the economics are favorable.
For calculating the ROI of loyalty programs specifically, the CLV:CAC ratio shows whether retention spending is justified. If a loyalty program costs $5 per customer annually but increases CLV by $80, the ROI is spectacular. If it increases CLV by $3, it's not worth running.
Navigating Common Pitfalls in CLV Calculation
Almost every brand makes at least one systematic CLV error. Identifying yours is crucial.
Using Revenue Instead of Gross Profit: This is the most common mistake. Revenue-based CLV makes every customer look valuable, leading to acquisition overspend. Brands end up acquiring customers who are actually unprofitable once costs are included. Always anchor CLV calculations to gross profit or gross margin.
Ignoring Churn Rate Changes: Churn isn't static. Seasonal changes, product updates, competitive pressure, and market shifts all affect churn. A formula using last year's 3% monthly churn might be dangerously wrong if current churn is 4.5%. Review churn quarterly and adjust CLV projections accordingly.
Averaging Across All Customer Segments: Treating customers identically is a major analytical error. A customer acquired through organic social might have 40% higher CLV than one acquired through paid social. A customer from East Coast might retain longer than West Coast. Segment by acquisition channel, geography, product category, and customer tier. Calculate CLV separately for each segment.
Confusing Average with Median: When customer lifespans vary wildly (which they do), the average gets skewed by outliers. One extremely loyal customer who shops for five years can drag the average up significantly. Median CLV (the middle value) is often more representative of your typical customer.
Poor Data Quality: Inconsistent customer identification, attributed transactions, or incomplete order tracking make CLV calculations meaningless. 58% of businesses struggle to accurately measure CLV, usually because their data infrastructure is weak. Invest in proper analytics tools. Platforms such as Mage Loyalty, Rivo, and Growave help Shopify merchants track customer behavior reliably.
Conclusion: Future-Proofing Your Business with Accurate CLV
The difference between a revenue-based CLV formula and a profit-based one is the difference between guessing and knowing. That distinction determines whether you'll acquire profitable customers or chase vanity metrics.
Understanding CLV moves you from a "growth at any cost" mentality to a "sustainable growth" mindset. You optimize for customer quality instead of customer quantity. You invest in retention because you can calculate its exact financial impact. You adjust acquisition spending based on actual customer economics, not wishful thinking.
A deep understanding of CLV empowers strategic decisions. It lets you say no to acquisition channels that seem productive but actually destroy profitability. It justifies investment in loyalty programs because you can measure the ROI precisely. It guides product development toward features that extend customer lifespan. It shifts your entire business orientation from transactional to relational.
The most successful Shopify brands don't chase the largest customer base. They chase the highest CLV. That discipline compounds over years. Five years of high-CLV customers creates a business with momentum, loyal advocates, and sustainable margins. Five years of chasing volume creates a treadmill where you must constantly acquire just to stay flat.
TLDR
Customer Lifetime Value is the total profit (not revenue) you expect from a customer, calculated as (AOV × Purchase Frequency × Customer Lifespan) × Gross Margin % for ecommerce, or (ARPU / Churn Rate) × Gross Margin % for subscriptions. Use profit-based formulas, monitor your CLV:CAC ratio (aim for 3:1 or higher), and boost CLV by increasing order value, purchase frequency, and customer lifespan while reducing churn. Most businesses fail at CLV measurement by using revenue instead of profit, ignoring churn changes, or averaging across diverse customer segments.
Frequently Asked Questions
What is the simplest formula for CLV?
Average Order Value × Purchase Frequency × Customer Lifespan gives you a basic revenue estimate. But add Gross Margin % to that formula for accuracy, since it accounts for the actual profit available after product costs.
Why is gross margin percentage so important in CLV calculations?
Gross margin converts revenue into profit. A customer generating $500 revenue at 30% gross margin contributes $150 profit. The same $500 revenue at 50% margin contributes $250. Ignoring margin makes high-volume customers with thin margins look valuable when they're actually marginal. Gross margin transforms CLV from a vanity metric to a financial measure.
How often should I recalculate CLV?
Calculate CLV at least quarterly to track trends. Monthly is better if you have stable operations and clean data. When you implement major retention initiatives (like a loyalty program), measure CLV impact month-to-month to validate ROI. Annual CLV calculations are too infrequent to catch emerging problems like churn increases.
What's the difference between historical and predictive CLV?
Historical CLV uses past customer data to calculate actual value—what customers already generated. Predictive CLV uses machine learning to forecast future behavior based on current engagement patterns. Historical CLV is straightforward; predictive requires more sophisticated analytics and is useful for identifying high-potential customers before they're proven valuable.