Ecommerce Conversion Rate Benchmarks 2026: Real Data & Industry Standards
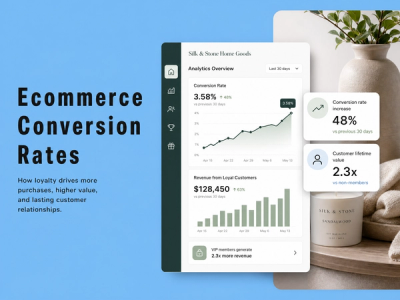
Most ecommerce merchants obsess over traffic and paid advertising, yet they're leaving serious revenue on the table by ignoring one uncomfortable truth: your conversion rate matters infinitely more than your visitor count. A store pulling 10,000 monthly visitors at a 3% conversion rate generates 300 sales. A competitor with half the traffic but a 6% conversion rate hits the same number—while spending far less on acquisition.
This gap between understanding conversion rates theoretically and optimizing them strategically is where most stores fail.
Understanding Your Ecommerce Conversion Rate: The Foundation
What is an Ecommerce Conversion Rate?
An ecommerce conversion rate is the percentage of visitors who complete a desired action on your store. Most commonly, that action is making a purchase—but it can also be signing up for an email list, adding items to a cart, or viewing a product page. Think of it as a measuring stick for how effectively your store turns browsers into buyers.
You'll encounter two conversion types worth tracking separately:
Macro conversions are your primary business goals—purchases, account signups, or high-value actions that directly drive revenue. Micro conversions are smaller actions that signal purchase intent: adding items to the cart, viewing a product detail page, starting checkout, or subscribing to a loyalty program. Tracking both gives you a complete picture of your customer journey.
How to Calculate Your Conversion Rate
The math is straightforward: divide the number of conversions by total visitors, then multiply by 100.
Number of Conversions ÷ Number of Visitors × 100 = Conversion Rate (%)
If 500 people visited your Shopify store last month and 12 completed a purchase, your conversion rate is (12 ÷ 500) × 100 = 2.4%.
What makes this simple formula deceptively powerful is that it forces you to define what "conversion" means for your business. An apparel brand might count both purchases and email signups. A SaaS company embedded in Shopify might only track trial starts. The clarity of your definition directly influences how you interpret and act on the data.
The 2026 Ecommerce Conversion Landscape: Real Data & Industry Standards
Overall Global Ecommerce Conversion Rate Benchmarks
The global average ecommerce conversion rate in 2026 ranges between 1.7% and 2.7%, depending on the data source and industry mix. According to Adobe, recent quarterly data shows 2.69% as an aggregate benchmark, while IRP Commerce and Triple Whale report tighter ranges closer to 1.9–2.1%.
Here's what this means practically: if you're converting 2% of visitors into buyers, you're tracking at or slightly below the global median. Conversion rates above 3% place you in the top quartile of stores—a meaningful competitive advantage.
The variance in these numbers reflects a critical reality: "average" obscures the actual distribution. Most stores cluster between 1–3%, but top performers regularly exceed 5%. The difference isn't usually traffic quality—it's intentional optimization and customer retention strategy.
Ecommerce Conversion Rate Benchmarks by Industry
Industry matters profoundly. A 2% conversion rate for luxury jewelry is exceptional. That same rate for food and beverage is dangerously low.
| Industry | Conversion Rate Range | Why It Varies |
|---|---|---|
| Food & Beverage | 4.5–6.0% | Lower price points enable impulse purchases; recurring consumption patterns drive repeat buying |
| Health & Beauty | 3.0–4.0% | Medium consideration; established online trust in category; many repurchase-driven customers |
| Fashion & Apparel | 2.0–3.0% | Higher return rates; style is subjective; significant mobile browsing before purchase |
| Home & Furniture | 1.8–2.8% | High-consideration purchases; longer decision cycles; expensive items reduce impulse buying |
| Electronics | 1.9–3.6% | Highly competitive; extensive research phase; price sensitivity influences conversion timing |
| Luxury & Jewelry | 0.8–1.2% | Extreme consideration; premium price points; fewer total transactions but higher order values |
| Pet Supplies | 3.5–4.5% | Frequent repurchasing; emotional attachment to products; subscription models boost repeat conversions |
The pattern is consistent: categories where the purchase is routine or low-cost convert higher. Categories involving significant financial or emotional commitment convert lower because buyers naturally spend more time in evaluation.
Conversion Rates by Device: Desktop vs. Mobile
Here's the friction point most merchants underestimate: desktop visitors convert at 3.5–4.0%, while mobile visitors convert at 1.5–2.0%. That's a 40–50% gap in the same store.
This isn't mysterious. Mobile shopping involves screen size constraints, keyboard friction, payment entry difficulty, and distraction. A user browsing on their phone is often in transit or multitasking. The purchase journey that feels natural on a 27-inch monitor becomes tedious on a 6-inch screen.
The implication: your mobile experience is functionally a different conversion problem than desktop. Optimizing one doesn't automatically optimize the other. Sites with exceptional mobile conversion rates typically invested specifically in streamlined mobile checkout, one-click payment options, and mobile-first product photography.
Ecommerce Conversion Rate Benchmarks by Traffic Source
Not all visitors are equally likely to convert. Where they came from matters.
| Traffic Source | Conversion Rate | Context |
|---|---|---|
| 4.0–5.3% | Highest intent; audience already familiar with brand; warm outreach | |
| Organic Search | 2.7–3.0% | Buyer already researching; moderate intent; natural landing page match |
| Paid Search (Google Ads) | 2.5–3.2% | Strong intent signaled by search query; commercial intent |
| Direct Traffic | 2.0–3.0% | Returning customers or brand searchers; moderate to high intent |
| Organic Social Media | 1.0–2.0% | Curiosity-driven; lower purchase intent; discovery phase |
| Paid Social | 0.7–1.2% | Broad targeting; lower intent than search; entertainment or awareness phase |
Email dominates because it reaches an audience that has already opted in and previously engaged. Paid social underperforms because its strength—reaching massive, cold audiences—creates a funnel where the vast majority have no purchase intent.
This tells you something actionable: if you're spending heavily on cold social traffic, even a 1% conversion rate might be acceptable if your unit economics work. But improving email conversion from 3% to 4% is likely more profitable per dollar spent than improving paid social from 0.8% to 1.2%.
Shopify Conversion Rate Benchmarks
Shopify stores specifically show an average conversion rate of 1.4–1.8%, according to aggregated merchant data. This aligns with the global median but skews slightly lower because Shopify hosts every store size and quality level.
What matters more than the average is where your store sits relative to your peers:
- Top 20% of Shopify stores: 3.2%+ conversion rate
- Top 10% of Shopify stores: 4.7%+ conversion rate
- Average Shopify store: 1.4–1.8% conversion rate
- Bottom 40% of Shopify stores: Below 1.2% conversion rate
The gap between median and top 10% suggests that conversion rate optimization is not evenly distributed. Most merchants accept their platform's baseline performance. Top performers treat it as a solvable problem.
Beyond Purchase: Key Conversion Funnel Metrics
Your final purchase conversion rate is the end result of earlier funnel stages. Understanding these intermediate metrics reveals where your actual friction lies.
The average add-to-cart rate across ecommerce is 7.52%—meaning roughly 1 in 13 store visitors actually place something in their cart. That's your first gate.
Of those visitors with items in their cart, 70% abandon before completing purchase. That leaves only 29.81% of add-to-cart events becoming actual purchases. Improve cart abandonment recovery even slightly, and your overall conversion rate jumps noticeably.
Many stores obsess over getting traffic to the product page but ignore the 70% of potential customers who make it to checkout and then leave. Recovery email campaigns targeting abandoned carts routinely achieve 15–30% recovery rates—pure margin improvement with minimal new traffic.
Ready to increase customer lifetime value?
Join 100+ Shopify stores using Mage to turn one-time buyers into loyal repeat customers.
New vs. Returning Customer Conversion Rates
Here's where loyalty becomes quantifiable. Returning customers convert at rates 20–50% higher than new customers, depending on industry. In high-loyalty categories like beauty, returning customers might convert at 8–10% while new customers sit at 3–4%.
This gap exists because returning customers have already decided they trust your brand and product quality. They're not re-evaluating every aspect of the purchase—they're just reordering. The mental friction is lower.
It's also why many high-performing stores have flipped their thinking: rather than obsess over acquisition, they focus on converting first-time buyers into repeat customers. A 3% converter who buys 6 times annually is worth infinitely more than 6 separate 3% converting new customers.
Beyond the Averages: Decoding the "Why" Behind Variances
Consumer Psychology and Market Maturity
Conversion rates aren't random. They reflect how audiences perceive risk and trust.
In mature, saturated categories like fashion, consumers have many options and high switching costs are low. They convert cautiously. In emerging categories or locally dominated markets, the early adopter effect increases conversion because buyers are less price-sensitive—they just want access.
Geographic variation matters too. Markets with high online penetration (US, UK, Germany) see conversion rates clustering around 2–3%. Developing markets often show higher volatility because online shopping infrastructure is newer and payment options are limited. A customer willing to navigate a payment system with fewer safeguards might be more committed, but others simply abandon.
Brand maturity compounds this effect. A D2C brand with zero marketing budget will see conversion rates in the 0.5–1% range among cold traffic. That same brand with a decade of brand equity and customer base converts new visitors at 3–4%.
Product Niche, Price Point, and Buying Cycle
A $9 skincare product has a different psychology than a $9,000 sofa. Low-ticket items generate impulse conversion. High-ticket items require consideration.
Similarly, consumables (replenishable goods) naturally convert better than durables (one-time purchases) because the buying friction resets monthly. A coffee subscription converts high-intent users repeatedly. A camera sale converts high-intent users once every 3–5 years.
This matters because it explains why benchmarking against "the industry average" can mislead you. Your actual comparable set is stores selling similar-priced items with similar purchase frequency. Compare a $30 subscription box to a $3,000 bed frame, and you're measuring different problems.
Website Experience, Design, and Technical Infrastructure
Beyond psychology, infrastructure determines conversion. A store with 3-second page load times converts noticeably better than a store with 6-second load times—all else equal. Mobile responsiveness isn't optional. A checkout process requiring 8 steps loses more customers than a 3-step process.
These elements are measurable. You can A/B test page speed impact. You can measure form field friction. Poor UX isn't an excuse for low conversion—it's a diagnosis.
The Untapped Potential: How Loyalty Programs Transform Conversion Rates
Here's where most conversion rate analysis stops short: it focuses on optimizing the first purchase but ignores the systematic advantage of converting repeat customers.
The Quantifiable Uplift: Loyalty's Direct Impact on Conversion
Stores implementing comprehensive loyalty programs see conversion rates lift 15–20% on average. That's not a marginal improvement—that's moving a 2% converter to a 2.3–2.4% converter, or a 3% converter to 3.45–3.6%.
The mechanism is straightforward: loyalty members feel invested in your brand. They've earned points or climbed a tier. The switching cost increases. They're more likely to complete a purchase because the friction of comparison shopping now includes the psychological cost of abandoning their status.
Loyalty members also generate 12–18% more incremental annual revenue than non-members. This compounds over time. The math that makes loyalty a transformative metric isn't the first-purchase conversion—it's the second, third, and tenth purchase conversions stacked together.
Loyalty Members vs. Non-Members: A Conversion Rate Divide
Real-world data shows the divide clearly. Non-loyalty members in a typical apparel store convert at 1.8–2.2%. Loyalty program members at the same store convert at 3.5–4.5%. The gap widens for categories with strong repurchase patterns.
Why? Loyalty membership signals buyer identity. A customer wearing a store's VIP badge (literal or psychological) is making a different calculation. They're not deciding whether to buy—they're deciding whether to buy now or wait.
Exclusive perks like free shipping thresholds or early sale access also create urgency that drives conversions otherwise lost to price comparison or wallet abandonment.
Mechanics of Motivation: How Loyalty Features Drive Conversions
Specific loyalty mechanics target different friction points:
Tiered Rewards Systems create progression narratives. Moving from Silver to Gold status motivates incremental spending. A customer 50 points away from tier advancement converts at higher rates because achieving the goal feels proximate. This is why brands like Sephora's tiered model consistently shows higher lifetime value—the gamification element works.
Personalization and Segmentation increase relevance. A loyalty program that knows a customer prefers sustainable fashion can show them organic cotton options preferentially. That friction reduction increases conversion. One-size-fits-all loyalty doesn't capture this edge.
Exclusive Access (early product drops, VIP events, special pricing) creates scarcity and social proof simultaneously. Loyalty members feel special, increasing emotional connection. They're also more likely to convert because exclusive deals feel time-limited.
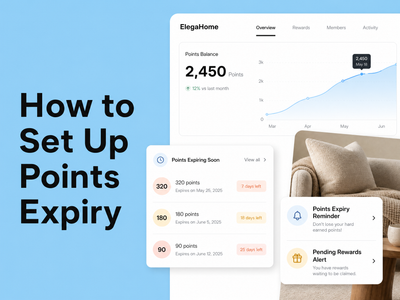
Visible Redemption Pathways matter profoundly. If a customer has 500 points and can't easily see what those points buy, they don't feel earned. Loyalty programs that make the redemption path obvious ("You're 200 points away from a free item") see higher engagement and conversion.
Opinion Against Standard Advice: Beyond Points—Why Hyper-Personalized Loyalty Experiences Drive Modern Conversions
Here's the contrarian take: basic points-for-purchase loyalty is becoming insufficient.
Most merchants launch point systems where customers earn 1 point per dollar spent and redeem 100 points for $10 off. It's simple. It's transactional. It's also undifferentiated—every competitor offers the same structure.
Modern consumers, especially Gen Z, don't want more points. They want to feel seen. They want exclusive experiences. They want brand community.
Data supports this shift. Tiered loyalty programs that combine points with experiential elements show 1.8x higher ROI than flat points programs. Hybrid models including referral rewards, social engagement incentives, and surprise-and-delight moments consistently outperform basic points systems in both conversion uplift (15–20%) and customer lifetime value (12–18% incremental revenue).
The future of conversion rate advantage isn't in your points math. It's in personalized, multi-touch loyalty experiences that make customers feel valued beyond transactional exchange.
Future-Proofing Your Conversions: AI, Personalization, and Emerging Trends
The Rise of AI in Conversion Rate Optimization
AI-driven personalization is shifting from "nice-to-have" to "table stakes." Platforms using machine learning to recommend products see conversion uplift of 10–15% in many categories. Predictive analytics identifying high-churn customers enable proactive retention outreach.
Generative AI is also reshaping product descriptions, review content, and dynamic pricing—all conversion levers. A store that dynamically adjusts pricing based on demand and inventory while maintaining customer perception of fairness sees materially better conversion than a store with static pricing.
Hyper-Personalization as the New Standard
The convergence of first-party data collection (replacing third-party cookies) and AI makes individualized experiences the new competitive norm. Stores that learn customer preferences and serve tailored experiences—product recommendations, email content, even homepage layouts—are seeing measurable conversion advantages.
This isn't speculation. Retailers like Amazon and Netflix proved the model works at scale. The tools are now accessible to any Shopify store.
The Blurring Lines: Social Commerce and Livestream Shopping
Conversion rates for social commerce (shopping directly within Instagram, TikTok) are often 20–40% higher than traditional ecommerce because friction is minimal and trust is peer-based. Livestream shopping events create urgency and entertainment simultaneously, driving conversion rates that often exceed traditional email campaigns.
These channels are fragmenting where conversions happen, but the principle remains: meet customers where they are, reduce friction, and build community.
Actionable Steps: Optimizing Your Ecommerce Conversion Rate in 2026
Step 1: Conduct a Comprehensive Conversion Audit
Start by mapping your actual funnel. How many visitors see your homepage? How many reach a product page? How many add to cart? How many complete purchase?
Use Google Analytics or your Shopify dashboard to build this waterfall. Identify where the biggest drop-off occurs. A 50% drop-off from homepage to product page suggests a navigation or discovery problem. A 70% drop-off from cart to purchase suggests checkout friction.
Supplement data with user feedback. Send exit-intent surveys. Use session recordings to watch how visitors actually browse. The gaps between what you think is happening and what's actually happening are where optimization lives.
Step 2: Enhance Your Mobile User Experience
If mobile converts 40–50% lower than desktop, your mobile experience is your biggest conversion lever.
Streamline navigation. Remove auto-playing videos and intrusive pop-ups on mobile. Simplify forms to ask for minimum required information. Ensure your product images load fast and are zoomable. Test your checkout on actual phones—don't assume responsive design equals good mobile UX.
One-click checkout options (Apple Pay, Google Pay) reduce friction dramatically. If you're not offering mobile wallet options, you're leaving conversions on the table.
Step 3: Streamline the Checkout Process
Every additional step in checkout increases abandonment. The industry standard is now 3 steps maximum (cart review, shipping info, payment). More than that, and abandonment jumps noticeably.
Offer guest checkout prominently. Requiring account creation before purchase is a conversion killer—users can always sign up post-purchase. Integrate diverse payment options. Some visitors prefer PayPal, others Klarna, others credit cards. Support multiple methods.
Display security badges and clear return policies at checkout. Trust signals at the moment of commitment reduce purchase hesitation.
Step 4: Leverage Personalization and Segmentation
Use your email list to segment by purchase history, browsing behavior, and stated preferences. Send personalized product recommendations based on past purchases or category interest.
Implement dynamic content on your site. Show returning customers a different homepage than new visitors. Highlight loyalty benefits if the visitor is already a member.
A/B test different personalization approaches. Some audiences respond to social proof (showing best-sellers). Others respond to exclusivity (showing newly arrived items). Test and adapt.
Step 5: Build Trust and Credibility
Display customer reviews prominently near product images. High-quality customer photos and integrate reviews with loyalty to increase authentic social proof. Testimonials matter—peer validation drives conversion.
Include clear security badges and SSL certificates. Spell out your return policy prominently. Responsive customer service—visible chat support or rapid email response—reduces the perceived risk of purchase.
Step 6: Implement a Data-Driven A/B Testing Strategy
Choose one element to test at a time. Test button color, copy, product page layout, or email subject line. Ensure your test runs long enough (minimum 1-2 weeks) to account for traffic variance. Use statistical significance calculators to ensure results are real, not random.
Document what works. Over 6 months, small A/B test wins compound into meaningful conversion uplift.
Step 7: Integrate an Advanced Loyalty and Engagement Strategy
This is your most direct path to above-benchmark conversion rates. Design a loyalty program that moves beyond basic points.
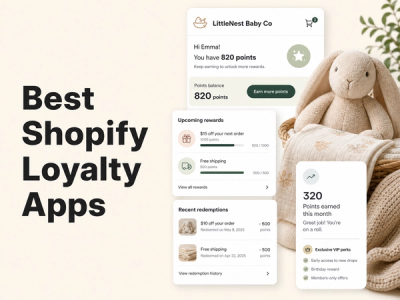
Build tiered membership with clear progression paths. Offer exclusive benefits at each tier—not just discounts, but exclusive access, early sales, or special customer service. Reward non-purchase behavior: reviews, referrals, social engagement, wishlist additions.
Consider a building a high-converting loyalty program that includes personalization—members see tailored product recommendations and birthday offers. Test referral incentives. Implement surprise-and-delight moments (random point bonuses) to increase engagement and emotional connection.
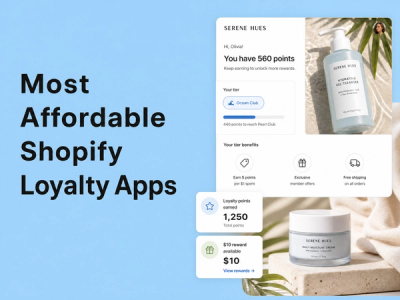
Platforms like Mage Loyalty, Rivo, and Growave make implementation straightforward. Choose based on your feature needs and integration requirements.
Measure impact. Track how loyalty members convert vs. non-members. Measure tier advancement rates. Monitor redemption frequency. Use data to refine the program.
Key Takeaways: Mastering Conversion Rates in a Competitive Landscape
Conversion rate optimization is not a one-time project. It's a continuous discipline.
Your benchmark is your baseline, not your target. A 2% conversion rate means 98% of visitors aren't converting. That's not acceptable if you understand why—and you can fix it.
The gap between median and top-quartile performance (1.4% vs. 4.7% for Shopify stores) isn't mystical. It reflects discipline in mobile UX, checkout simplification, personalization, and systematic loyalty-driven retention.
Loyalty programs, specifically, are underutilized conversion tools. They work not because they're novel but because they're psychologically sound. Customers who've invested emotionally in your brand convert at materially higher rates and generate higher lifetime value.
Start with diagnosis (audit), move to quick wins (checkout, mobile), then invest in the systematic advantage (loyalty and personalization).
Frequently Asked Questions About Ecommerce Conversion Rates
What is a good ecommerce conversion rate in 2026?
A good ecommerce conversion rate varies by industry but generally falls between 2.5% and 3.5%. For Shopify stores specifically, anything above 2.0% is acceptable, while 3.2%+ places you in the top 20%. Food and beverage categories often see 4.5–6.0%, while luxury goods typically convert at 0.8–1.2%. Context matters more than absolute numbers—benchmark against your specific industry and traffic sources, not global averages.
How do I find my current ecommerce conversion rate?
Your conversion rate is calculated by dividing total purchases by total visitors, then multiplying by 100. In Google Analytics, navigate to Conversions > Overview and note the conversion rate displayed. In Shopify, check your sales dashboard to see total orders and compare against your traffic source data (Google Analytics or your ad platform's reporting). Ensure you're measuring the same time period across both data sources to avoid discrepancies.
What is the difference between desktop and mobile conversion rates?
Desktop visitors typically convert at 3.5–4.0%, while mobile visitors convert at 1.5–2.0%—a gap of roughly 40–50%. This difference exists because mobile shopping involves screen constraints, keyboard friction, payment difficulty, and higher distraction rates. If your mobile conversion rate is significantly lower than your desktop rate, your mobile UX likely needs optimization in speed, navigation, form simplification, and one-click payment options.
Can loyalty programs truly impact my conversion rate?
Loyalty programs directly impact conversion rates by 15–20% on average. Members convert at higher rates because they feel invested in your brand, experience reduced switching costs, and benefit from exclusive perks and personalized experiences. Beyond the first-purchase conversion, loyalty programs drive 12–18% more incremental annual revenue from members through repeat purchases and higher order values, making them one of the highest-ROI conversion optimization tools available.
How do I choose between different loyalty program platforms?
When evaluating loyalty apps for Shopify (Mage Loyalty, Smile.io, LoyaltyLion, Growave, and others), prioritize platforms that offer tiered rewards, personalization capabilities, and seamless integrations with your email and SMS tools. Check whether the app supports your specific features—VIP tiers, referral rewards, review incentives, and social engagement. Compare pricing against your expected member growth, and test free trials to ensure the user experience aligns with your brand before committing.
How often should I review and adjust my conversion rate benchmarks?
Review conversion rate performance monthly to identify trends and seasonal patterns. Conduct deeper analysis quarterly to assess whether your optimizations are moving the needle. Industry benchmarks shift annually based on market maturity and technological change, so update your target benchmarks at least once per year—typically in Q1 for calendar-year planning. Continuous testing means your personal benchmarks should shift upward regularly if optimization efforts are working.