Shopify store owners that fail to measure Cost Per Retained Customer often leave 25-95% of potential profit gains on the table, even while driving strong acquisition numbers.
Understanding your retention costs is just as critical as tracking customer acquisition expenses. Yet most ecommerce merchants optimize one metric while ignoring the other, creating blind spots in their financial strategy.
Cost Per Retained Customer (CPRC) is the total investment a company makes to keep existing customers engaged and purchasing over a specific period. It's the financial twin of Customer Acquisition Cost (CAC), and together, these metrics form the backbone of sustainable ecommerce profitability.
While acquisition gets most of the attention—board meetings, marketing budgets, performance dashboards—retention often hides in the background. That invisibility costs you money.
This guide pulls CPRC into focus. You'll learn how to calculate it, why it matters more than most merchants realize, and exactly how to use it to drive genuine competitive advantage for your Shopify store.
Beyond the Obvious: Why Measuring CPRC is Critical, Not Optional
Here's the myth that costs ecommerce brands real dollars: "Retention is always cheaper than acquisition, so I don't need to measure it as carefully."
That sounds logical. And it contains a grain of truth. Acquiring new customers costs 5 to 25 times more than retaining existing ones across most industries. The numbers are real. But the conclusion merchants draw from them is dangerously wrong.
Just because retention can be cheaper doesn't mean your retention spending is actually efficient. A poorly designed loyalty program with low engagement, excessive discounting, or weak redemption mechanics can waste thousands monthly without anyone noticing. Email campaigns sent to unengaged segments. Customer service tools that don't reduce churn. Promotional offers that attract price-sensitive shoppers who leave after one purchase.
These retention efforts exist. The money vanishes. And without rigorous CPRC measurement, you'll never see it happening.
The merchants who win track CPRC with the same intensity they track CAC. They ask harder questions. Is this retention dollar actually keeping customers? Is this loyalty program paying for itself? Should we reduce our email frequency or increase it? These questions demand measurement.
When you nail CPRC, the profit multiplier kicks in. A 5% increase in retention boosts profits by 25-95%, depending on your industry and business model. That's not incremental. That's a game-changer.
Higher retention also compounds customer lifetime value (LTV). A customer retained for three years instead of one generates triple the revenue per acquisition dollar spent. That shifts your entire unit economics.
Retained customers convert at 60-70% rates compared to 5-20% for new prospects. Your email marketing performs better. Your product recommendations resonate more. Your brand gets stronger. And critically, your retained customers become brand advocates. They refer friends, leave reviews, and create social proof that organically reduces your future acquisition costs.
The virtuous cycle only happens if you measure it. CPRC reveals whether that cycle is actually working.
The Mechanism: Calculating Your Cost Per Retained Customer
The formula is straightforward. The execution requires precision.
Total Retention Expenses ÷ Number of Retained Customers = Cost Per Retained Customer
Define your period first. Monthly is ideal for spotting trends. Quarterly works for larger businesses. Annual provides strategic perspective but can hide seasonal swings.
"Retained customers" means customers who made at least one purchase during your measurement period after their initial purchase. Some merchants count only repeat customers. Others include engaged members who haven't purchased yet but are active in the loyalty program. Pick a definition and stay consistent.
Now the hard part: retention expenses.
For ecommerce and Shopify stores specifically, retention expenses include far more than most merchants initially account for. Here's the full picture.
Loyalty program costs covers everything. Platform fees if you're using a Shopify loyalty program. Point rewards you award to customers. Discount codes redeemed. Promotional bonuses during campaigns. Administrative time to manage tiers, rules, and communications.
Customer service and support goes in. Your support team salaries or outsourced platform fees. Help desk software. Training costs. A customer who has a friction-free support experience stays longer. That costs money. Count it.
Email marketing and SMS campaigns for existing customers. Platform fees (Klaviyo, Omnisend, Postscript). Content creation. List segmentation and maintenance. Automation infrastructure. If you send one email per week to 10,000 loyalty members, that infrastructure cost matters.
Re-engagement campaigns targeting at-risk or dormant customers. Retargeting ad spend. Win-back email sequences. Special discount offers for lapsed buyers. These are pure retention spend.
Personalization and customer experience tools like optimizing customer accounts, CRM platforms, recommendation engines, and customer data platforms. These enable targeted retention at scale.
Onboarding and post-purchase communications designed to reduce early churn. Welcome series costs. Post-purchase education. Unboxing experience optimization. Order confirmation sequences.
Promotional discounts and exclusive offers targeted at high-value or at-risk segments. The margin hit from loyalty-only discounts counts as retention expense.
Relationship management infrastructure. Analytics dashboards. Customer segmentation tools. Integrations between your Shopify store, loyalty app, and email platform. The person managing all this.
Let's walk through a real calculation. A mid-sized Shopify store selling home goods.
Monthly Retention Expenses:
- Loyalty platform subscription: $200
- Loyalty rewards issued: $1,200 (points redeemed by customers)
- Email marketing platform: $300
- SMS campaigns: $150
- 1 full-time support team member (allocated 60% to retention): $2,500
- Re-engagement ad spend: $800
- Personalization tool subscription: $400
Total: $5,550
Customers Retained That Month: 450 customers who had purchased before and made a repeat purchase
CPRC: $5,550 ÷ 450 = $12.33 per retained customer
This store can now compare. Is $12.33 worth the repeat purchase value they're getting? Average repeat customer order value is $85. Margins are 35%. So each retained customer generates roughly $30 in gross profit per transaction. At $12.33 CPRC, the economics work. But if repeat frequency is only 1.2x per year, the lifetime value per acquisition becomes fragile.
That's the insight CPRC creates. Measurement reveals trade-offs.
The Shopify loyalty program growing brands trust
See how Mage helps Shopify brands lift repeat purchase rate with loyalty, referrals and store credit.
Book a demoCPRC vs. CAC: Forging a Balanced Growth Strategy
CAC and CPRC tell completely different stories, but they're only useful when read together.
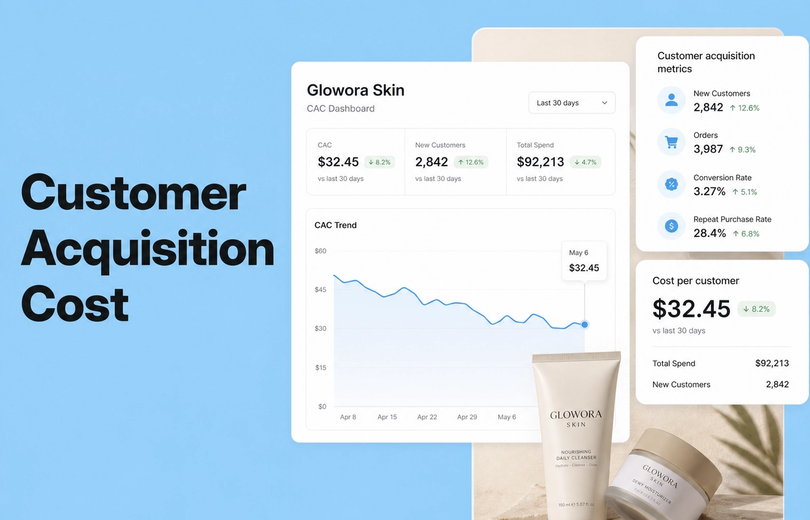
Customer Acquisition Cost shows what you paid to bring someone to your store. Let's say your CAC is $40. That means $40 in ad spend, creative costs, and landing page creation for every new customer who lands.
CPRC shows what you pay to keep that customer coming back. If your CPRC is $12, you're spending $12 monthly (or quarterly, depending on your period) to maintain engagement, rewards, and communication.
The naive move: focus only on CAC. Slash ad spend. Optimize landing pages. Win new customers at $30 CAC instead of $40.
The sophisticated move: understand the CAC:CPRC ratio.
If your CAC is $40 and CPRC is $12 monthly, each customer costs you $40 to acquire. Retaining them costs $12/month, or $144/year. A customer who stays three years costs $40 + $432 in total retention investment to generate lifetime value. If that customer spends $300 total, the math is tight. If they spend $1,000, you're printing money.
The strategic question: where should the next dollar go?
That depends on your situation. If you're at 20% repeat purchase rate and your market is still underpenetrated, acquisition likely wins. Lower CAC. Grab market share. If you're at 60% repeat purchase rate and acquisition is getting expensive, retention likely wins. Invest in loyalty. Increase LTV.
The key is honest comparison. Many merchants spend 80% of budget on acquisition and 20% on retention by default, not by design. They've never calculated CPRC. They've never asked whether that allocation actually reflects their unit economics.
Here's a framework: Calculate your CAC payback retention period. How long does a customer need to stay to recoup the acquisition cost through repeat purchases? If CAC is $40 and average repeat order value contribution margin is $20, that's two repeat purchases. Two months if you're a subscription. Twelve months if you're a fashion brand.
Now map that against your actual retention curve. What percentage of customers stay that long? If 70% stay long enough to break even on CAC, your acquisition investment is solid. If only 30% do, your retention strategy is the bottleneck. Fix that before scaling acquisition.
A healthy CAC:CPRC ratio varies by business model. SaaS companies often run 3:1 or tighter (CAC payback in 3-4 months). Ecommerce brands typically run 5:1 to 8:1 (payback in 5-8 months). Luxury goods might be 10:1 (payback takes longer but LTV is higher).
The ratio only matters in context. What matters is whether your retention spend is actually moving the needle on repeat purchase frequency, average order value, and customer lifetime value.
“Cannot say enough good things about the team at Mage Loyalty, one of the absolute best organizations we have ever worked with, full stop! So glad we connected with them, completely redid our loyalty program, new concepts, use of loyalty, increasing user engagement, showing us where we were not valuing our best customers, just WOW, amazing team!”


Read the West Coast Goalkeeping case study →
Loyalty Programs: The CPRC Game Changer
Loyalty programs aren't just marketing theater. When designed properly, they're precision CPRC reduction machinery.
Here's why. A well-structured customer loyalty program changes the financial mechanics of retention fundamentally.
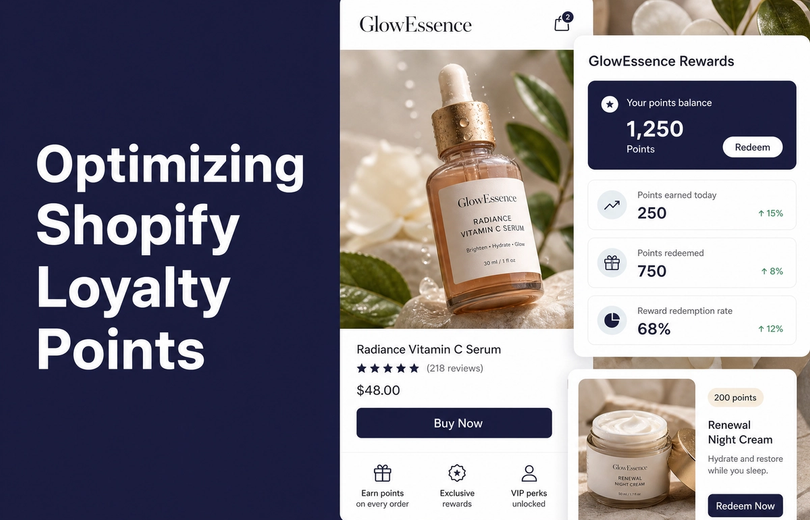
First: repeat purchase frequency increases. A points-based system where customers earn 1 point per $1 spent, redeemable for $20 off every 2,000 points, creates a mathematical incentive to return. That customer who bought once six months ago now makes three purchases per year. Your retention costs stay roughly constant, but spread across three transactions instead of one. CPRC per transaction drops.
Second: average order value climbs. Tiered loyalty programs create aspiration. Bronze members get 1% back. Gold members get 5% back. Suddenly, customers spend to reach the next tier. A $60 order becomes $85. The margin improvement directly offsets loyalty costs.
Third: churn collapses among engaged members. Loyalty program members see 23-30% higher retention rates than non-members. That's not accident. It's reciprocity. Customers who feel invested in a program are less likely to drift to competitors.
Fourth: data quality explodes. Loyalty members identify themselves. You know their purchase history, preferences, birthday, location. That transforms your email and SMS from generic blasts into precise, personal communication. Personalized emails convert 6x better than batch sends. Your retention spend suddenly works harder.
Fifth: advocacy compounds. Top-tier loyalty members refer friends. They leave reviews. They post on social media. Real Shopify loyalty program examples show that 20-30% of referral revenue comes from top tier members. That's indirect acquisition cost reduction.
To measure whether your loyalty program is actually reducing CPRC, track these KPIs obsessively.
Loyalty member retention rate vs. non-member retention rate. If members retain at 55% and non-members at 35%, your loyalty program is delivering. Calculate the revenue lift: additional customer retained × average LTV. That's your loyalty ROI.
Repeat purchase rate lift. Non-members might repeat at 30%. Members at 60%. That 30-point lift is everything. Map it to loyalty program engagement—how many members are inactive, monthly active, highly active. Engagement drives repeat.
Average order value by loyalty tier. Bronze members spend $80/order. Gold members spend $120/order. That's your tier effectiveness. If tiers aren't driving AOV increases, your tier structure is broken.
Email engagement from loyalty messages. Track open rates, click rates, conversion rates on loyalty-specific emails vs. general marketing sends. Loyalty members should outperform by 40-50%. If they don't, your messaging isn't resonating.
Cost of rewards vs. incremental revenue generated. You issued $5,000 in points/discounts last month. That drove $25,000 in incremental revenue from loyalty members above their baseline. That's a 5:1 return. Healthy. Keep going. If it's 1.5:1, you're spending too generously.
For Shopify merchants, the levers are concrete. A fashion brand might set up a points-for-purchase program where customers earn 1 point per $1, with 500 points redeemable for $25. At 35% margins, that $25 reward costs them $9. But if those points drive customers to shop 1.5x more frequently per year than they otherwise would, the incremental revenue justifies the cost.
A consumables subscription might layer on a referral program where each successful referral earns the advocate 100 points toward a free box. If average referral value is $200 and you acquire a customer at $40 CAC equivalent via points, you're stacking acquisition efficiency with retention efficiency.
The difference comes down to execution: do you actually measure the impact? Or do you just let the program run and hope?
Measuring Granular ROI: Beyond the Aggregate CPRC
Aggregate CPRC gives you altitude. But flying at altitude means you miss the terrain.
When you calculate total retention expenses divided by retained customers, you're blending everything together. That loyalty program. That customer service investment. That email platform. That re-engagement campaign. All pooled into one number.
The problem: you don't know which retention dollar is working and which is bleeding.
Granular ROI attribution asks: which specific retention effort actually moved the needle?
Here's why it matters. Your $5,550 monthly retention budget might include $1,200 in loyalty rewards, $800 in re-engagement ads, $300 in email platform costs, and $2,500 in support salaries. If you're only looking at overall CPRC of $12.33, you don't know if that $800 re-engagement ad spend is converting lapsed customers back or just showing ads to people who were going to return anyway.
Start with this framework: isolate one retention tactic and measure its impact over 4 weeks.
For a specific email re-engagement campaign: Calculate how many dormant customers received it. Track how many purchased within 14 days. Note their average order value. Subtract the email platform costs and creative time. Is the incremental revenue greater than the cost? If emails to dormant segments generate $3 in incremental revenue per person reached at a cost of $0.50, you've got a 6:1 return. Keep doing it.
For customer service improvements: Before you implement live chat support, measure churn among customers with support tickets. Let's say it's 40%. After implementation, measure again. If it drops to 30%, you've reduced churn by 25%. Calculate the LTV impact. One retained customer at $300 LTV is worth $300. If live chat adds 20 retained customers monthly at a cost of $1,200, that's $6,000 value for $1,200 cost. 5:1 return. Justified.
For loyalty program tiers: Compare repeat purchase rate, AOV, and referral generation across Bronze, Silver, and Gold members. If Gold members cost $50/month in rewards but generate 3x the repeat revenue of Bronze members, that tier structure is efficient. If all tiers cost the same and perform the same, your tier design is lazy.
The challenge: attribution gets messy in reality. A customer who received a re-engagement email, saw a retargeting ad, and had a great support experience probably returned because of all three, not one. You can't cleanly isolate.
But you can get close enough to make decisions.
Use control groups. Send the re-engagement email to 80% of your dormant list. Hold back 20% as control. Compare purchase rates. The difference is your email's true impact.
Use temporal isolation. One month, focus on customer service improvements. Track retention. Next month, dial back support and ramp email campaigns. Track retention. See what moved.
Use cohort analysis. Compare retention curves for customers who are highly engaged with your loyalty program vs. those who never engaged. The gap reveals loyalty's impact.
The point: stop accepting aggregate CPRC as destiny. Break it apart. Measure. Reallocate based on what's actually working.
Potential Pitfalls and Challenges in CPRC Management
Not all retention spend is created equal. And not all retention spending is actually retaining.
Inefficient spending is silent. You launch a loyalty program. Month one costs $1,200. You retain 100 customers. CPRC looks like $12. Sounds good. But what if those 100 customers would have returned anyway? What if your true incremental retention is only 20 customers? Your real CPRC is $60. That changes everything.
This happens constantly. Merchants invest in retention efforts without establishing a baseline. They don't know what the counterfactual is—what would retention look like if they did nothing?
Fix it: for new initiatives, always run a small test first. A/B test your new email sequence. Launch your loyalty program to 50% of your list. Measure retention lift against the control. Only scale once you've proven incremental impact.
"Buying" loyalty vs. earning it is the classic trap. You discount heavily. You give points generously. Short-term repeat purchase rates spike. CPRC looks justified. But then something breaks.
Your most engaged customers—the ones who return for the product, community, or brand—see no reason to stay if a competitor offers deeper discounts. Your acquisition attracts price shoppers, not brand loyalists. Margins compress. Churn accelerates. Suddenly, that CPRC that looked great in month one becomes a millstone by month six.
This happens because you optimized for repeat purchase rate and lost sight of quality. Not all retained customers are equal. A customer who stays because they love your brand and has 40% margins is worth more than one who stays only for discounts at 10% margins.
Over-reliance on discounts devalues your brand. Every loyalty program gives discounts. But if discounts are your only value prop, you become a commoditized vendor. Customers don't feel special. They feel price-conscious.
The brands that truly lower CPRC layer discounts with exclusivity. Early access to new products. Exclusive designs. Community access. These create perceived value that costs you nothing to deliver.
Ignoring qualitative feedback kills retention design. You're measuring points earned, emails opened, redemption rates. But you never talk to customers about why they stay or why they leave.
A two-minute survey after a lapsed customer's last purchase could reveal that your reward tier felt unachievable, or your emails were too frequent, or your product quality slipped. That feedback costs you nothing and repays a thousand times over in CPRC optimization.
Data silos wreck accuracy. Your Shopify store tracks transactions. Your loyalty app tracks points and engagement. Your email platform tracks sends and opens. Your support system tracks tickets. None of them talk to each other.
When you try to calculate CPRC, you're stuck guessing which retention expenses drove which customer outcomes. You lose precision. You can't attribute revenue to initiatives.
Fix it: invest in integrations. Most Shopify loyalty platforms integrate with Klaviyo integration and other marketing tools. Connect your loyalty platform to your analytics. Create a single source of truth for customer behavior.
The merchants who truly master CPRC don't just measure the metric. They obsess over data quality. They run tests. They allocate budget based on evidence, not assumptions. They optimize relentlessly. And they reap 3-5x better retention economics than competitors who treat retention as an afterthought.
Key Metrics That Amplify Your CPRC Insights
CPRC doesn't exist in isolation. These companion metrics give it context and reveal optimization opportunities.
Customer Retention Rate (CRR) is the percentage of customers from one period who are still customers in the next period. If you had 1,000 customers in January and 650 of them purchased again in February, your February CRR is 65%. This metric shows the big picture health of your retention. CPRC shows the cost to achieve that CRR. Together they reveal whether you're overspending or underspending on retention.
Churn Rate is the inverse. The percentage of customers who left. If CRR is 65%, churn is 35%. High churn with high CPRC means your retention strategies aren't working. High churn with low CPRC means you're not investing enough. The mismatch is diagnostic.
Customer Lifetime Value (LTV) is the total revenue you expect from a customer over their lifetime with you. LTV should be 3-5x your CAC for healthy ecommerce businesses. It should also be significantly higher than your CPRC × customer lifetime. If CPRC is $12/month and average customer lifetime is 24 months, that's $288 in retention investment. If LTV is $400, the math works. If LTV is $350, your retention spend is eating into profitability.
Repeat Purchase Rate is what percentage of customers who bought once come back and buy twice. Existing customers convert at 60-70% compared to new prospects at 5-20%. This metric shows whether your retention base is actually sticky. Loyalty programs should meaningfully lift repeat purchase rate. If they don't, your loyalty program design is broken.
Average Order Value (AOV) among retained customers vs. new customers reveals whether your loyalty efforts are attracting high-value repeat buyers or discount-chasing price shoppers. Loyalty members' AOV should be 15-25% higher than non-members. If it's flat, your tier structure isn't working.
Net Promoter Score (NPS) measures customer willingness to recommend. It's not a retention cost metric, but it's a leading indicator. High NPS correlates with high retention and high referral rates. If your CPRC is low but NPS is declining, you might be buying loyalty rather than earning it.
Time Between Purchases shows engagement quality. Customers who repurchase every 45 days are more valuable than those who repurchase every 180 days, even if both have the same LTV. TTB decreasing means your retention efforts are working. TTB increasing means engagement is slipping.
Map all of these alongside CPRC monthly. Patterns emerge. You'll see which retention investments actually move these metrics, and which are noise.
Practical Strategies for Reducing Your Cost Per Retained Customer
Reducing CPRC doesn't mean cutting corners. It means directing retention spend more intelligently.
Enhance customer experience at the critical moments. Most merchants invest in email and loyalty programs but neglect the post-purchase experience. A fast ship, a great unboxing, a simple returns process—these cost less than expected but dramatically reduce early churn. Customers who have a friction-free first experience are 70% more likely to repeat. Start there.
Personalize at scale. Generic emails convert at 2%. Segmented emails convert at 5%. Personalized emails convert at 12%. You don't need to hand-write messages to every customer. Use data to segment by purchase history, browsing behavior, or loyalty tier, then send targeted offers. Same email volume, 6x conversion lift. CPRC drops.
Streamline onboarding relentlessly. New customers are fragile. A confusing loyalty signup process, unclear reward mechanics, or a delayed first email can kill retention before it starts. Your onboarding sequence should be simple, clear, and delightful. Test every step. Friction increases churn. Clarity increases loyalty.
Segment strategically for retention investment. Not all customers are equally profitable to retain. High-value customers might be worth $1,500 LTV. Low-value customers might be $150 LTV. Spend accordingly. VIP members deserve 1-on-1 service. Standard members get email. That allocation efficiency lowers CPRC while improving satisfaction.
Gather feedback continuously and act on it. Surveys, reviews, social listening—these cost almost nothing but reveal why retention is working or failing. One customer insight can inspire a product improvement or process change that moves the needle more than any marketing campaign.
Optimize loyalty program structure quarterly. Loyalty programs get stale. Engagement drops. Redemption rates change. Review your program quarterly. Are tier economics still sound? Do reward thresholds still feel achievable? Should you introduce limited-time bonuses or seasonal campaigns? Small adjustments compound.
Automate re-engagement but personalize the message. A customer hasn't purchased in 60 days. Automation should flag this and trigger a win-back email sequence. But the email should feel personal—reference their past purchases, suggest complementary products, or offer a personalized discount. Automated infrastructure, human touch.
Invest in product quality first. The best retention program can't offset a mediocre product. Customers who love what you sell stay regardless of loyalty mechanics. Customers who are indifferent won't stay even with discounts. Build the product so good that retention becomes the natural outcome, and loyalty programs simply amplify it.
Conclusion: Mastering Retention for Sustainable Growth
CPRC separates merchants who understand their unit economics from those who fly blind.
Most ecommerce founders focus obsessively on CAC. They track it daily. They optimize landing pages for it. They build financial models around it. Then they wonder why, despite low CAC, margins stay tight and growth stalls.
The answer is usually hiding in CPRC.
They're spending efficiently to acquire customers, then inefficiently to keep them. Or they're not measuring retention costs at all, so they have no idea whether their programs are working.
The merchants winning right now measure both. They understand the relationship. They know their CAC:CPRC ratio. They test retention initiatives before scaling them. They increase Customer Lifetime Value through precise retention strategy.
This creates a compounding advantage. Lower CPRC means higher LTV. Higher LTV means better unit economics. Better unit economics means you can profitably acquire more customers. Loyalty members refer friends. Those referrals have lower CAC. Suddenly you're not grinding in a constant acquisition treadmill.
The path is clear. Calculate your CPRC. Understand what drives it. Measure the ROI of individual retention efforts. Optimize ruthlessly. Treat retention not as an afterthought but as the core growth lever it actually is.
Your next step is simple: pull your retention expense data for the last three months. Divide by retained customers. Know your number. Then ask whether you're happy with it. If not, you know exactly what to fix.
Frequently Asked Questions
What's the difference between CRC and CPRC?
Cost Per Retained Customer (CPRC) and Customer Retention Cost (CRC) refer to the same metric—the total investment required to keep an existing customer engaged and purchasing. Some sources use the terms interchangeably. The formula is identical: Total Retention Expenses / Number of Retained Customers. The distinction is purely semantic. CPRC emphasizes the per-unit cost calculation, while CRC is the broader concept.
What's a good CPRC for an ecommerce business?
CPRC benchmarks vary significantly by industry and business model. Fashion and apparel brands typically run CPRC between $8-$18 monthly, spread across email, loyalty, and support. Subscription and consumables brands often see $5-$12 monthly because repeat purchase frequency is built-in. Luxury brands might accept $20-$40 monthly because LTV is substantially higher. The key metric isn't the absolute CPRC—it's whether your CPRC:LTV ratio is healthy. If annual CPRC is less than 20% of LTV, the economics work.
How often should I calculate my CPRC?
Calculate CPRC monthly minimum. This gives you trend visibility and lets you spot problems quickly. A monthly CPRC of $12 might look fine in isolation, but if it was $8 three months ago, you're losing efficiency. Investigate why costs are rising. Quarterly reviews can highlight seasonal patterns, which is useful for budgeting and strategy. Annual calculations show long-term trajectory but are too slow for optimization.
Can a high CPRC ever be justified?
Yes, if LTV is proportionally higher. A luxury jewelry brand might have CPRC of $50/month because service, personalization, and VIP treatment are expected. But LTV could be $3,000-$5,000. That math works. Similarly, a B2B SaaS retention cost might be high in absolute terms but justified by high customer value. What matters is the ratio: CPRC should be 10-25% of annual LTV for sustainable profitability. If it exceeds that, either lower CPRC or increase LTV.
How do I convince my team to prioritize CPRC?
Frame CPRC in terms they understand. For finance teams: CPRC + CAC determines unit economics and profitability. Lower CPRC means higher margins on the same revenue. For marketing: CPRC directly impacts your ability to profitably acquire customers. A 10% reduction in CPRC frees up budget for acquisition. For product: high CPRC signals product quality issues or experience friction. For executive leadership: CPRC is the lever that turns acquisition efficiency into sustainable growth.
Which loyalty platforms handle CPRC measurement best?
What differs is integration depth with your email and CRM systems. Platforms with strong integrations let you correlate loyalty program activity with revenue, making CPRC calculation easier. Some offer built-in attribution reporting; others require you to export data and calculate manually. Evaluate based on your current tech stack and analytics maturity.

Kris is the co-founder of Mage Loyalty. I spend most days talking to merchants, and making sure our customers get real results. If you run a Shopify store or Agency we should chat!