A referral program can look busy while producing very few profitable new customers if you measure shares, clicks, and orders as one number. Ecommerce referral program benchmarks only become useful when each stage of the funnel has its own definition, denominator, and attribution window.
Short answer: There is no single referral program benchmark. Share rate, click-through rate, referred-customer conversion, and referral revenue contribution describe different stages. Use external research as directional context, then judge your own program against comparable cohorts and a consistent measurement method.
A well-built Shopify referral program gives customers a unique link or code, tracks the resulting order, and makes the full funnel visible. The job is to determine where performance weakens, then fix that stage instead of chasing a vague industry average.
Referral program benchmarks start with the metric definition
Share rate versus share-action rate
Share rate is the percentage of eligible referral prompts that lead to a sharing action, such as copying a link, sending an email, or opening a messaging option. It measures advocate activation, not acquisition.
Use a precise denominator. “Shares divided by members” can be useful for a quarterly member-health review, but “share actions divided by referral-prompt views” tells you whether the prompt itself earns attention.
Referral click-through rate
Referral click-through rate measures clicks on a referral link divided by link sends, link impressions, or recorded share actions. Those denominators are not interchangeable.
Record the tracking convention beside the metric. Otherwise, a change in channel mix can look like a conversion problem.
Referred-customer conversion rate
Referred-customer conversion rate is the percentage of referred visitors or leads who complete your chosen event. That event might be account creation, first purchase, or both.
Mage lets merchants define a referral conversion as signup, purchase, or both. Pick one primary business definition, usually an approved first purchase, and keep signup conversion as a separate supporting metric.
Referral order and revenue contribution
Referral contribution shows how much of total store output comes from approved referred customers. Calculate it as referred orders or revenue divided by all orders or revenue in the same period.
Every benchmark should include the numerator, denominator, conversion event, attribution window, and exclusions.
“I looked into so many different integrations for loyalty and referrals for our Shopify Store, but no one impressed me more than Mage on human connection, customer service, and value.”


Read the Reelie case study →
Current ecommerce referral program benchmarks for share and contribution
| Metric | What to measure | Why it matters | How to interpret it |
|---|---|---|---|
| Share-action rate | Share actions from eligible prompt views | Advocate activation | Compare placements, messages, and advocate cohorts |
| Referral click-through rate | Referral clicks from one stated sharing event | Friend interest | Segment by sharing channel and landing page |
| Approved referral conversion | Approved first purchases from referred sessions | Acquisition quality | Exclude refunds, fraud, and self-referrals |
| Referral contribution | Approved referral orders or revenue from total store output | Program impact | Compare consistent periods and cohorts |
Use directional context, not a universal target
There is no universal ecommerce share rate or referral contribution target. Program maturity, product price, customer base, reward value, attribution rules, and channel mix can all change the result.
Start with your own baseline over a consistent period. External research can help frame questions, but your prior cohort is the comparison that can guide an operating decision.
Referral order contribution
Referral order and revenue contribution should be measured as approved referral orders or revenue divided by total orders or revenue for the same period.
This is a merchant-level contribution measure. It does not tell you what percentage of referred visitors purchased, or whether those orders remained profitable after rewards and returns.
Why percentile comparisons can still help
Averages can hide the spread between inactive programs and programs with a strong advocate base. Percentile context is useful for setting questions: are customers seeing the offer, are they sharing it, and are friends buying?
Use comparable cohorts where possible. A newly launched program, a seasonal campaign, and an always-on program should not be judged on the same week of data.
How to calculate referral conversion rate without fooling yourself
| Metric | Formula | Recommended denominator | Common mistake |
|---|---|---|---|
| Share rate | Share actions divided by prompt views | Eligible prompt views | Using all customers regardless of exposure |
| Click-through rate | Referral clicks divided by sends or share actions | One stated sharing event | Mixing sends and clicks from different channels |
| Referral conversion rate | Approved first purchases divided by referred sessions | Referred sessions | Counting signups as purchases |
| Referral revenue contribution | Approved referral revenue divided by total revenue | Total store revenue | Including refunded referral orders |
A simple referral funnel formula
Track the funnel in order: eligible prompt views, share actions, referral clicks, referred sessions, signups, first purchases, approved referrals, and repeat purchases. Each stage answers a different operational question.
For an illustrative example, 10,000 prompt views, 500 shares, 250 referred sessions, and 20 first orders produces a 5% share rate, a 50% click rate from shares, and an 8% referred-session-to-first-order conversion rate. Those figures are an example, not an industry benchmark.
The denominator choices that change the result
Use referred sessions as the denominator for purchase conversion if your goal is acquisition efficiency. Use referred leads if visitors must create an account before they can redeem. Do not combine the two in the same chart.
Also separate gross conversions from approved conversions. A first order that is canceled, refunded, flagged as fraudulent, or attributed to a self-referral should not inflate the quality benchmark.
Mage assigns each participant a unique referral link or code and tracks qualifying purchases automatically. Its fraud controls can block self-referrals, aliases, duplicate accounts, suspicious shared-IP activity, repeat devices, and rapid referral bursts. Exclude blocked activity before evaluating performance.
What good referred-customer LTV looks like versus other channels
| Metric | Referral cohort | Comparison cohort | Adjustment to make |
|---|---|---|---|
| Revenue LTV | Customers acquired through approved referrals | Paid, organic, email, or direct customers | Same cohort start date and measurement window |
| Repeat purchase rate | Referred first-time buyers | Same new-customer cohort | Match product mix and geography |
| Contribution margin | Revenue after incentives and returns | Revenue after channel costs | Include rewards, discounts, and shipping subsidies |
| Retention | Customers active at a defined interval | Customers from another source | Use the same new-customer definition |
Compare cohorts, not blended channel averages
Referred-customer LTV is the revenue or contribution value produced by customers acquired through referrals over a stated period. Compare it with paid, organic, email, and direct cohorts that started in the same period and bought comparable products.
Use matching windows such as 30-day, 90-day, 180-day, and 12-month value. A referral cohort acquired during a product launch should not be compared with a paid cohort acquired during a clearance event.
Use contribution margin and retention alongside revenue LTV
Revenue alone can flatter a referral program with expensive incentives. Net referred-customer value should account for referral rewards, discounts, shipping subsidies, returns, and fraud losses.
Track repeat purchase rate and gross margin after incentives alongside LTV. This is where cost per retained customer belongs beside acquisition cost.
Why referral customers may be more valuable, but not always
A 2011 Journal of Marketing study found referred customers had at least 16% higher average value than comparable non-referred customers. It examined approximately 10,000 customers at a German bank over almost three years, so it is supporting research, not a DTC promise.
A later replication found higher loyalty but not consistently higher customer value. Run the cohort comparison in your own store before changing reward economics.
Why top-performing referral programs beat the average

Visibility at the moment of satisfaction
Referral prompts work best when customers have a reason to recommend the product. Ask after a positive purchase moment, successful delivery, or reward redemption, rather than burying the program in a footer.
One-to-one sharing paths
Prioritize copy link, email, SMS, and messaging options where customers already communicate one-to-one. Test which channels your advocates actually use rather than assuming a large row of social icons will drive shares.
A clear friend offer and a credible advocate reward
The friend should understand the offer immediately. The advocate should know what they earn, when it arrives, and what qualifies.
Test double-sided rewards because they give both people a reason to act. Keep minimum spend, reward expiry, and product exclusions easy to understand.
Relevant landing pages and low-friction redemption
A referral link should send the friend to a page that matches the shared offer and product context. Sending everyone to the homepage forces them to reconstruct why they clicked.
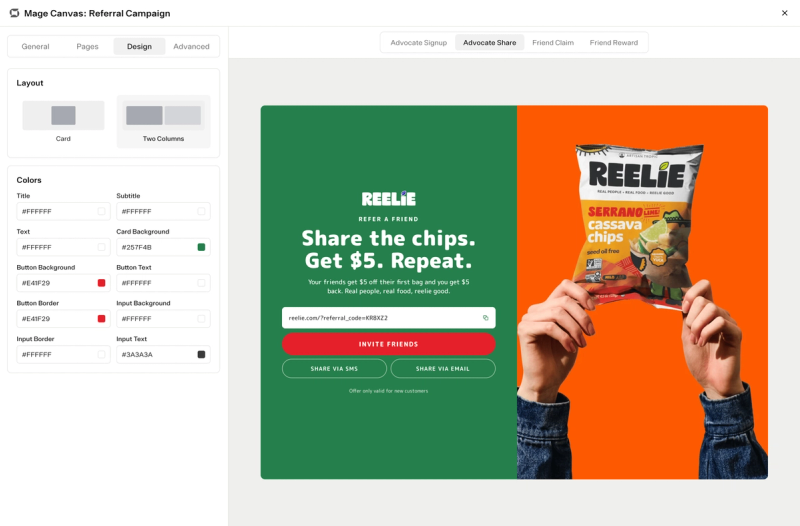
Mage referral campaigns can use dedicated landing pages, embedded content, A/B testing, and custom styling. That makes it practical to test a product-led landing page against a broader brand offer.
Fraud prevention and delayed reward approval
Reward timing affects reported performance and actual profitability. Hold advocate rewards until the return window closes when refunds are common, then measure approved orders rather than gross orders.
Read more about loyalty program metrics that actually matter when referral performance needs to connect to retention.
How referral performance changes by product, price, and channel
AOV and margin
Price changes the sensible incentive and payback period, but it does not determine whether a customer will recommend a product. Set reward economics around contribution margin, return rates, and the value of a retained customer.
Replenishment versus infrequent purchase cycles
Replenishment categories can reveal repeat purchase and second-referral behavior quickly. High-AOV categories may generate fewer referrals, but each approved order can carry more value and justify a different reward structure.
A beauty loyalty program may have a shorter reorder cycle than a high-consideration purchase, so its referral cohorts mature sooner.
Referral traffic versus referral-program traffic
Organic word of mouth and incentivized referral traffic should be reported separately. Track whether the customer used a link or code, which sharing channel generated the visit, and whether the order met your approval rules.
Why industry averages can mislead
Segment results by category, first-order AOV, customer type, device, geography, advocate cohort, and acquisition channel. Broad industry rankings often mix stores with different margins, product cycles, and program maturity.
A practical referral program benchmark dashboard for Shopify
Weekly operating metrics
Review eligible prompt views, share actions, share rate, referral clicks, landing-page conversion, blocked attempts, and pending rewards each week. A sudden drop in share rate may indicate a placement or messaging issue before it appears in revenue.
Monthly quality metrics
Track referred first orders, approved referral conversion rate, referral order contribution, referral revenue contribution, reward cost, and cost per referred order. Segment each metric by advocate cohort and sharing channel.
Mage analytics can report referral volume, conversion rate, top advocates, revenue, channel performance, and cost per referred order. Mage integrations can also connect loyalty data with the tools you use to measure and communicate with customers.
Quarterly financial metrics
Review referred-customer 90-day and 12-month LTV, repeat purchase rate, gross margin after incentives, payback period, and second-referral rate. Compare the same windows across acquisition sources.
Set a baseline during the first 30 to 90 days, then compare future cohorts against that baseline before reacting to an external percentile.
FAQ
What is a good referral program conversion rate for ecommerce?
A good referral program conversion rate is the percentage of referred visitors or leads who complete a clearly defined event, usually an approved first purchase. There is no universal target because results change with the denominator, reward, product price, attribution window, traffic source, and whether refunds or fraud are excluded.
What is a good ecommerce share rate?
A good ecommerce share rate depends on how share actions are defined and how often eligible customers see the referral prompt. Use your own historical performance as the primary benchmark, then compare results by placement, advocate cohort, and sharing channel.
How do you calculate referral conversion rate?
Referral conversion rate equals completed referral conversion events divided by referred visitors or referred leads, multiplied by 100. State whether conversion means signup, purchase, or both, then apply one attribution window and exclude canceled, refunded, duplicate, self-referred, and blocked activity from the approved result.
What is referred customer LTV?
Referred customer LTV is the revenue or contribution value generated by customers acquired through a referral during a defined cohort window. Calculate it after referral rewards, discounts, shipping subsidies, returns, and fraud losses, then compare it with other acquisition cohorts using the same dates, product mix, and customer definition.
Do referred customers have higher lifetime value than customers from other channels?
Referred customers may have higher lifetime value than customers from other channels, but the result is not guaranteed. Academic research found higher average value in one financial-services dataset, while a later replication found stronger loyalty without consistently higher customer value, so merchants should compare their own matched cohorts.
What separates top-performing referral programs from average ones?
Top-performing referral programs combine visible prompts, easy one-to-one sharing, a clear friend offer, a credible advocate reward, and landing pages that match the shared message. They also approve rewards carefully, prevent invalid referrals, measure channel performance, and track whether referred customers become repeat buyers and advocates themselves.
Use external benchmarks to spot questions, not to set blind targets. Define the funnel, measure approved outcomes, compare cohorts fairly, and change the part of the program that is actually limiting profitable referral growth. Mage supports unique referral links or codes, configurable conversion events, referral analytics, and fraud controls through its Shopify referral program.

Graeme is the co-founder at Mage Loyalty. He heads product development, from complex loyalty migrations and large-scale data handling to building the features shaping the future of loyalty on Shopify.