Time to second purchase is the number of days between a customer's first order and their second order, taken as the median across every customer who came back. It is the retention metric almost nobody reports, and it is the one that tells you how quickly a new customer starts paying back what you spent to acquire them.
Short answer: export your Shopify orders, group them by customer, work out the gap between each customer's first and second order, and take the median rather than the average. Then shrink that number with status, replenishment, relevant cross-sells and something worth unlocking on the second order. Do not shrink it with a discount email at day 20.
This post is the written version of the time to second purchase chapter in our ecommerce retention masterclass. The clip above starts at the point where Kris walks through the calculation.
What time to second purchase actually measures
Repeat purchase rate tells you whether customers come back. Time to second purchase tells you how long they take. The second question has a direct line to cash.
Every customer you acquire has a cost attached. If you spent $50 to get the first order, the only question afterwards is how many more orders you can get from that customer and how fast. A customer who returns in 30 days recovers that $50 and frees up budget to acquire the next one. A customer who returns in 120 days leaves you waiting a full quarter for the same money.
We define the metric strictly:
- It only counts customers who have placed at least two orders. Customers with one order have no gap to measure.
- The gap is measured in days from the first order date to the second order date.
- The reported figure is the median of those gaps, not the mean.
That last rule is where most spreadsheets go wrong, so it deserves its own section.
Why the median, not the average
Line up five customers and their gaps between first and second order: 20 days, 25 days, 30 days, 35 days and 600 days.
| Customer | Days to second order |
|---|---|
| Customer 1 | 20 |
| Customer 2 | 25 |
| Customer 3 | 30 |
| Customer 4 | 35 |
| Customer 5 | 600 |
| Average | 142 |
| Median | 30 |
The average is 142 days. That number is useless. Four of the five customers came back within five weeks, and one customer who wandered back after nearly two years has dragged the figure to somewhere nobody actually returned. If you planned your flows, replenishment timing or tier windows around 142 days, you would be building for a customer who does not exist.
The median is 30 days. Line every gap up in order, take the middle value, and you get the point at which customers are genuinely returning. It is the number to put on the dashboard and the number to try to shrink.
The same problem shows up at scale. Every mature store has a few hundred customers with 400-day gaps, and they inflate an average far above typical behaviour. The median ignores them.
Why it matters more than repeat purchase rate alone
Kris makes the same comparison from the customer journey side in the second masterclass; the clip below starts at that point.
Two brands both report a 35% repeat purchase rate. On paper they look identical. Brand A has a median time to second purchase of 30 days. Brand B has 120 days.
They are completely different businesses.
Brand A recovers its acquisition cost four times faster. It gets its cash back sooner, it can reinvest in the next customer sooner, and it has room for a third order inside the same window that Brand B spends waiting for a second one. If you only track repeat purchase rate, you would never see the gap between them.
The compounding example
Take it one step further. Brand A does 2.3 orders per customer per year. Brand B does 2.0. Both have 10,000 customers and an identical $50 average order value.
Brand A: 23,000 orders. Brand B: 20,000 orders. A difference of 0.3 orders per customer is 3,000 extra orders, which at $50 each is $150,000 of additional revenue in the year. Nothing about the AOV, the conversion rate or the repeat purchase rate would have told you that. It comes entirely from customers returning sooner and therefore more often.
This is why we treat it as the constraint metric for most Shopify brands. The second purchase problem is not only that customers fail to return. It is that the ones who do return take too long.
How to get the number from Shopify
Shopify does not report time to second purchase as a standard metric, so you calculate it from an order export. It takes twenty minutes in a spreadsheet.
- Export your orders from the Shopify admin for a fixed window. A rolling 12 months works well; it captures enough second orders to be meaningful without mixing in behaviour from years ago.
- Keep three columns: customer identifier (email or customer ID), order date and order number. Remove cancelled and fully refunded orders.
- Sort by customer, then by order date, so each customer's orders sit in sequence.
- For each customer with two or more orders, subtract the first order date from the second order date. That is their gap in days.
- Take the median of all the gaps. That is your time to second purchase.
Once you have the headline number, segment it. The median across the whole store hides the useful detail. We split it three ways:
- By first product or first category. Some entry products lead to a second order in three weeks, others in three months. This tells you which products deserve the acquisition budget.
- By acquisition channel. Customers from one channel often come back noticeably faster than those from another. That should change how you value each channel, not just its first-order ROAS.
- By quarter of first order. Customers acquired in a Black Friday sale behave differently from customers acquired at full price in March. Comparing cohorts by quarter also lets you see whether the number is improving over time.
Recalculate the median every quarter with the same method, and compare it to the previous quarter and the same quarter last year.
How to shrink time to second purchase
The goal is not only to get customers back; it is to get them back sooner. Everything below compresses the gap without cutting the price, which is the whole point of the bring customers back sooner chapter of the masterclass.
Give status a clock
A progressive VIP tier system rewards customers more as their lifetime value grows, and the version that shrinks the gap is the rolling year. In any 12-month window the customer must have met the spend threshold to hold their tier; orders that fall outside the window drop off. Not calendar year, not lifetime status. A rolling window gives every customer a reason to make the next purchase before the previous one expires, which is exactly the behaviour you want. The rewards do not have to be discounts either. Early access to launches and sales, exclusive VIP products and members-only events are performing best right now. Our Shopify VIP tiers feature is built around this rolling model.
Shorten replenishment cycles
If you sell anything consumable and run subscriptions, look at the default cycle. Many brands default to 60 or 90 days when the product genuinely runs out in 40, 45 or 30. Some categories are closer to 14. Shortening the default cycle to match real usage is the simplest lever on this list.
Segment by the first category
Based on what the customer bought first, cross-sell a highly relevant alternative category. If they bought a black t-shirt, market jeans and a white t-shirt. If they bought shampoo, market conditioner. A generic campaign of everything you sell is easy to ignore; a specific product they have not tried yet, that sits naturally next to what they already own, is what brings them back sooner. The same segmentation continues by VIP tier once they have one, and scales to the fifth and tenth purchase.
The Shopify loyalty program growing brands trust
See how Mage helps Shopify brands lift repeat purchase rate with loyalty, referrals and store credit.
Book a demoMake the second order unlock something
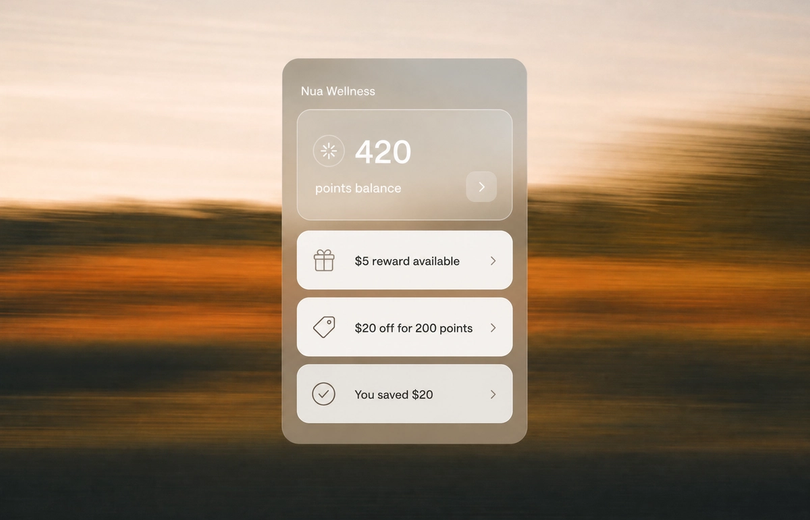
Set a tier or reward threshold, based on your expected AOV, that the second order almost always reaches. Then market it: the customer is one order away from a free gift, a free product, an exclusive event or a permanent perk. A progress bar in the email does most of the work. A free product performs particularly well here, because it is a reward for buying rather than a reduction in price. This is also where a loyalty program stops being a points balance and starts being a reason to act.
Educate and show proof
A lot of second-order hesitation is simply uncertainty. Product education (how the range works together, why it is formulated the way it is), reviews, testimonials and user-generated content all remove that uncertainty. We reward media reviews far more generously than text reviews for this reason: photos and video of real customers using the product shorten the decision for the next one, and customers who see media reviews want to add their own.
“I looked into so many different integrations for loyalty and referrals for our Shopify Store, but no one impressed me more than Mage on human connection, customer service, and value.”


Read the Reelie case study →
What not to do: the day 15 to 30 discount flow
The classic mistake is the win-back flow. A customer buys, 15 or 20 or 30 days pass without a second order, and an email goes out with 15% off. It feels like a fix because it produces some orders. It is not a fix.
The problem is what it teaches. If waiting produces a discount, the rational thing to do is wait. If the discount scales the longer they hold out, they hold out longer. You have increased time to second purchase for every customer who noticed the pattern, and paid margin to do it.
Acquire the second purchase first, then reward it. You may still use discounts later in the journey, but not as the bribe for order two. By the second order you have trust, familiarity and data, so the second to third step gets easier on its own. Train customers that the more loyal they are, the more they are rewarded, not that the longer they wait, the cheaper it gets.
Where this fits
Time to second purchase is the metric, but it is rarely the root cause. If the product disappoints or there is nothing else in the range to buy, no flow will compress the gap. Run the retention hierarchy first to confirm the constraint really is the retention system. Once the second order is landing sooner, the next job is the third purchase, where a repeat buyer becomes a loyal customer, and the playbook for growing repeat revenue after the first purchase takes over.
The customer journey masterclass covers the same metric from the customer's side: what the message and the experience should look like in the weeks between order one and order two.
FAQ
What is a good time to second purchase?
It depends on the category. A consumable with a 30-day usage cycle should see a median well under 60 days; a considered apparel purchase may sit at 90. Rather than chasing a benchmark, compare your own median quarter on quarter and by first product. A number that is falling is the goal.
Should I use the median or the average for time to second purchase?
The median. A small number of customers with very long gaps (600 days in our example) pull the average to a figure that no typical customer matches. The median gives you the point at which customers actually return.
Does Shopify report time to second purchase?
Not as a built-in metric. Export your orders, group them by customer, calculate the gap between each customer's first and second order and take the median. Segment it by first product, channel and quarter to find where the real differences are.

Kris is the co-founder of Mage Loyalty. I spend most days talking to merchants, and making sure our customers get real results. If you run a Shopify store or Agency we should chat!